





Employee metrics are quantitative measures that help an organization understand how people join, grow, perform, stay, and experience work. They are also called HR metrics, workforce metrics, or people analytics metrics. The useful metric is not the one that fills a dashboard. It is the one that changes a decision.
A focused set of nine measures can cover three practical questions: Can you retain and acquire the people you need? Are employees developing and performing in context? Can people do sustainable work in an environment where they can speak up? This guide explains the formula, review cadence, context, and responsible action for each metric.
Thomas Forstner, Vice President of People & Talent at Juro, contributed the people-operations perspective that grounds this guide.
There are a ton of metrics you could measure as a People and Talent lead at a fast-growth company. But tracking them all simply is not valuable. Instead, you should be economical and focus on a few metrics that can tell you the most about your function, keeping the rest in the background until you need to delve a bit deeper. The hard choice is deciding which metrics to focus on and which to put on the backburner. Ultimately, you want to grow your team consistently with strong talent, facilitate their development, and ensure they are fulfilled and engaged in their role.
Start with the business decision, then choose the smallest amount of data needed to support it. The CIPD describes people analytics as analyzing data about people to solve business problems. That definition is useful because it keeps the work tied to an outcome instead of encouraging measurement for its own sake.
A metric also needs a comparison point. Depending on the question, that may be a prior quarter, an internal cohort, a hiring plan, a documented service level, or a role-specific expectation. A universal benchmark can hide more than it reveals. Review the trend, segment it only where privacy permits, and decide in advance what action a material change will trigger.
- Retention and acquisition: team growth, turnover, and aggregated retention-risk signals.
- Performance and development: onboarding success, career progression, and calibrated performance reviews.
- Wellbeing and satisfaction: employee Net Promoter Score, psychological safety, and paid-time-off utilization.
Employee metrics for retention and acquisition
Retention and acquisition metrics show whether workforce capacity is moving in the direction the operating plan requires. Read these measures together. Rapid hiring with high regrettable turnover can produce little real capacity, while a stable team may still have an emerging retention problem inside one critical cohort.
How fast is your team growing?
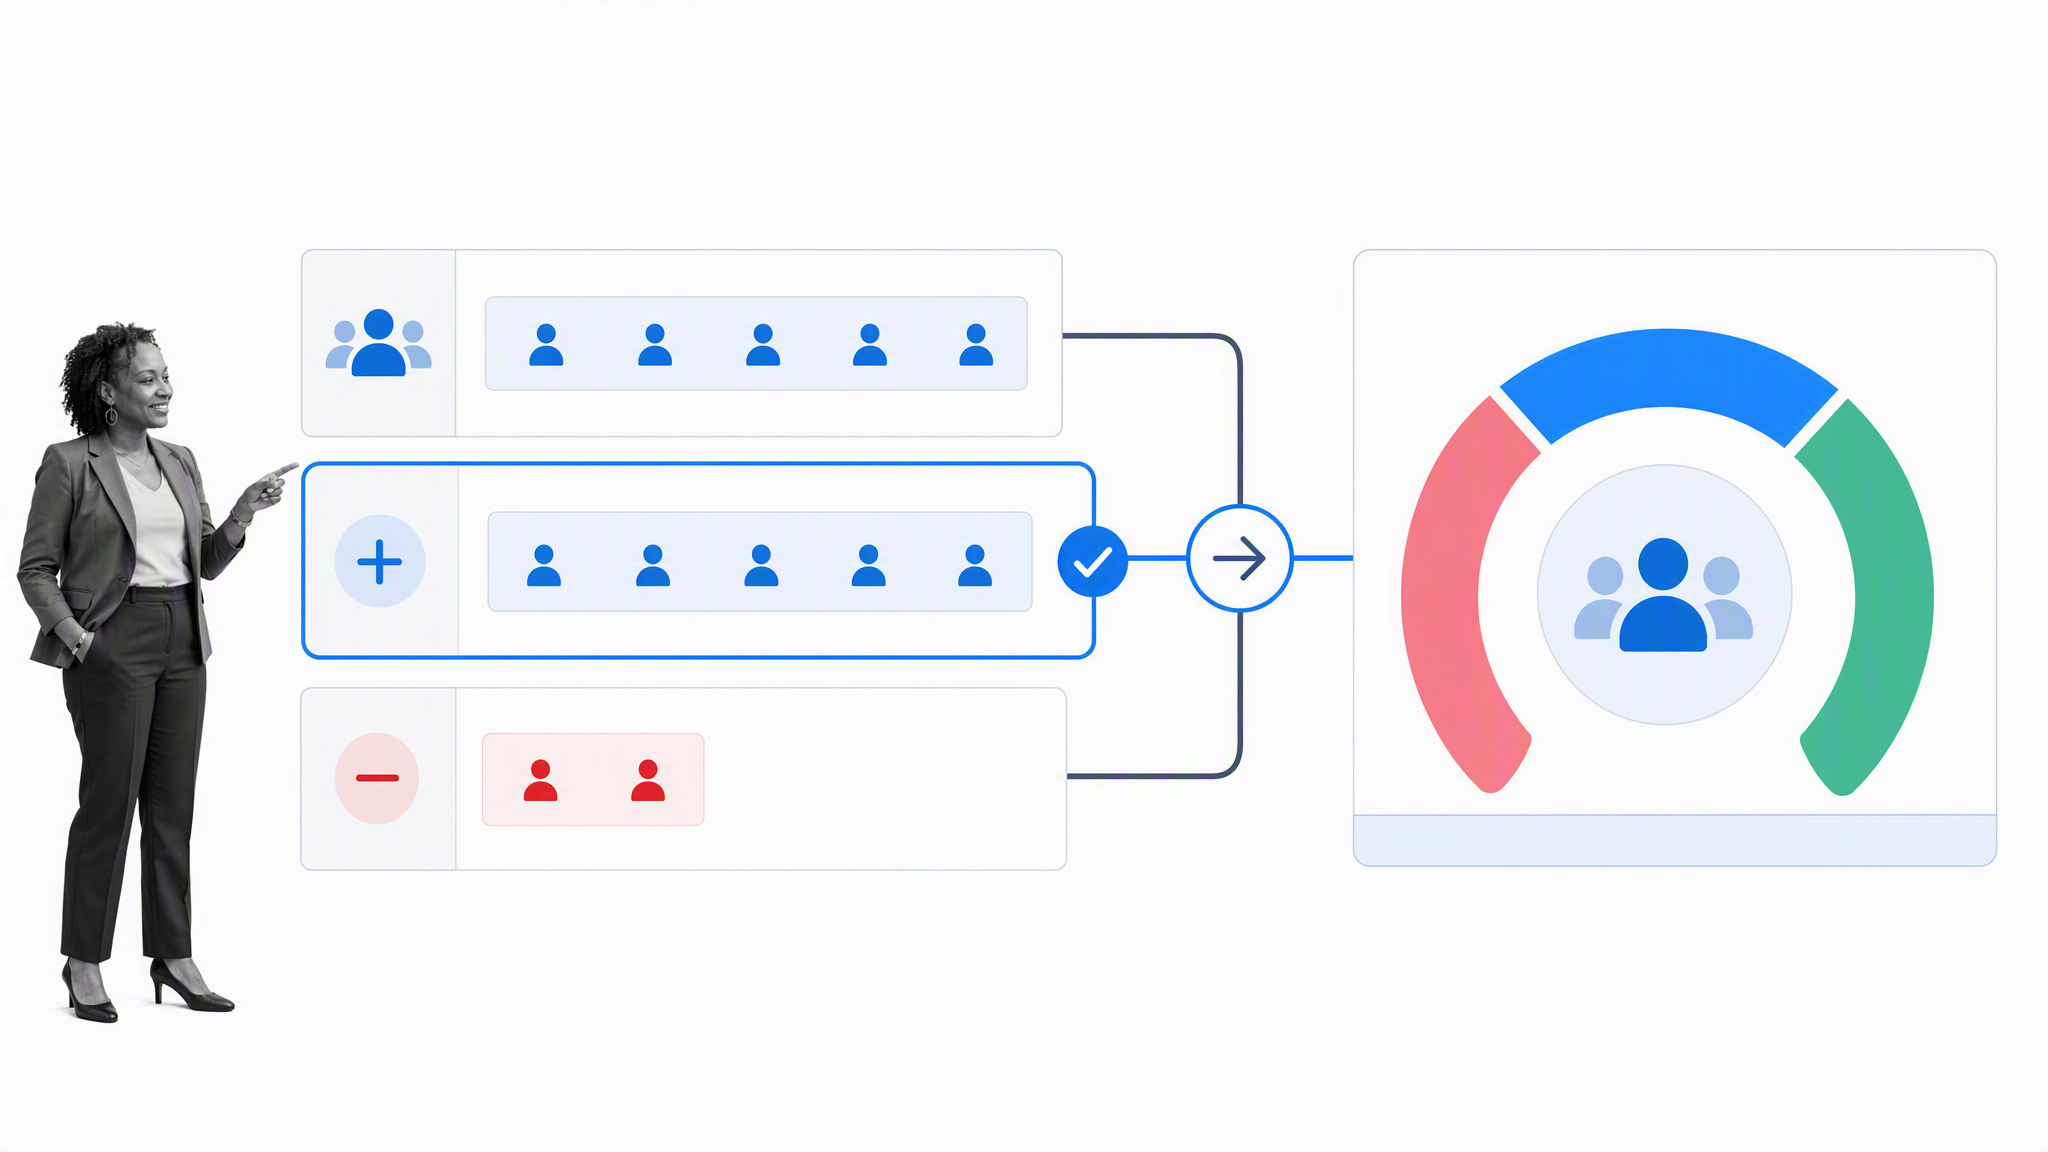
Headcount growth rate = (ending headcount – starting headcount) / starting headcount x 100. Use consistent start and end dates, and define whether contractors, interns, and employees on leave are included. A monthly calculation works for most teams, while a weekly operational view may be useful during a hiring surge.
Growth is not automatically good or bad. Compare it with approved capacity plans, revenue expectations, workload, and the time needed for new hires to become productive. A senior hire who creates leverage across a function may be more valuable than adding several roles without clear work or management capacity. Track joins and exits beside the net figure so opposite movements do not disappear inside one percentage.
Headcount growth metrics can be tracked in a wide range of ways. A small but fast-growing company might aim to double headcount within the next year, while another business might aim to hire a certain number of employees each month or per quarter. Build in some degree of flexibility because hiring the right candidate slightly later will typically be better than hiring the wrong person according to schedule. Senior positions also need more time and resources, so growth targets may need to fluctuate to accommodate them.
Use the result to decide whether to open roles, slow hiring, rebalance workloads, or improve workforce planning. The goal is enough capable capacity for the work, not the largest possible team. A governed HR analytics process can keep definitions, evidence, owners, and recurring review steps consistent.
What is your employee turnover rate?
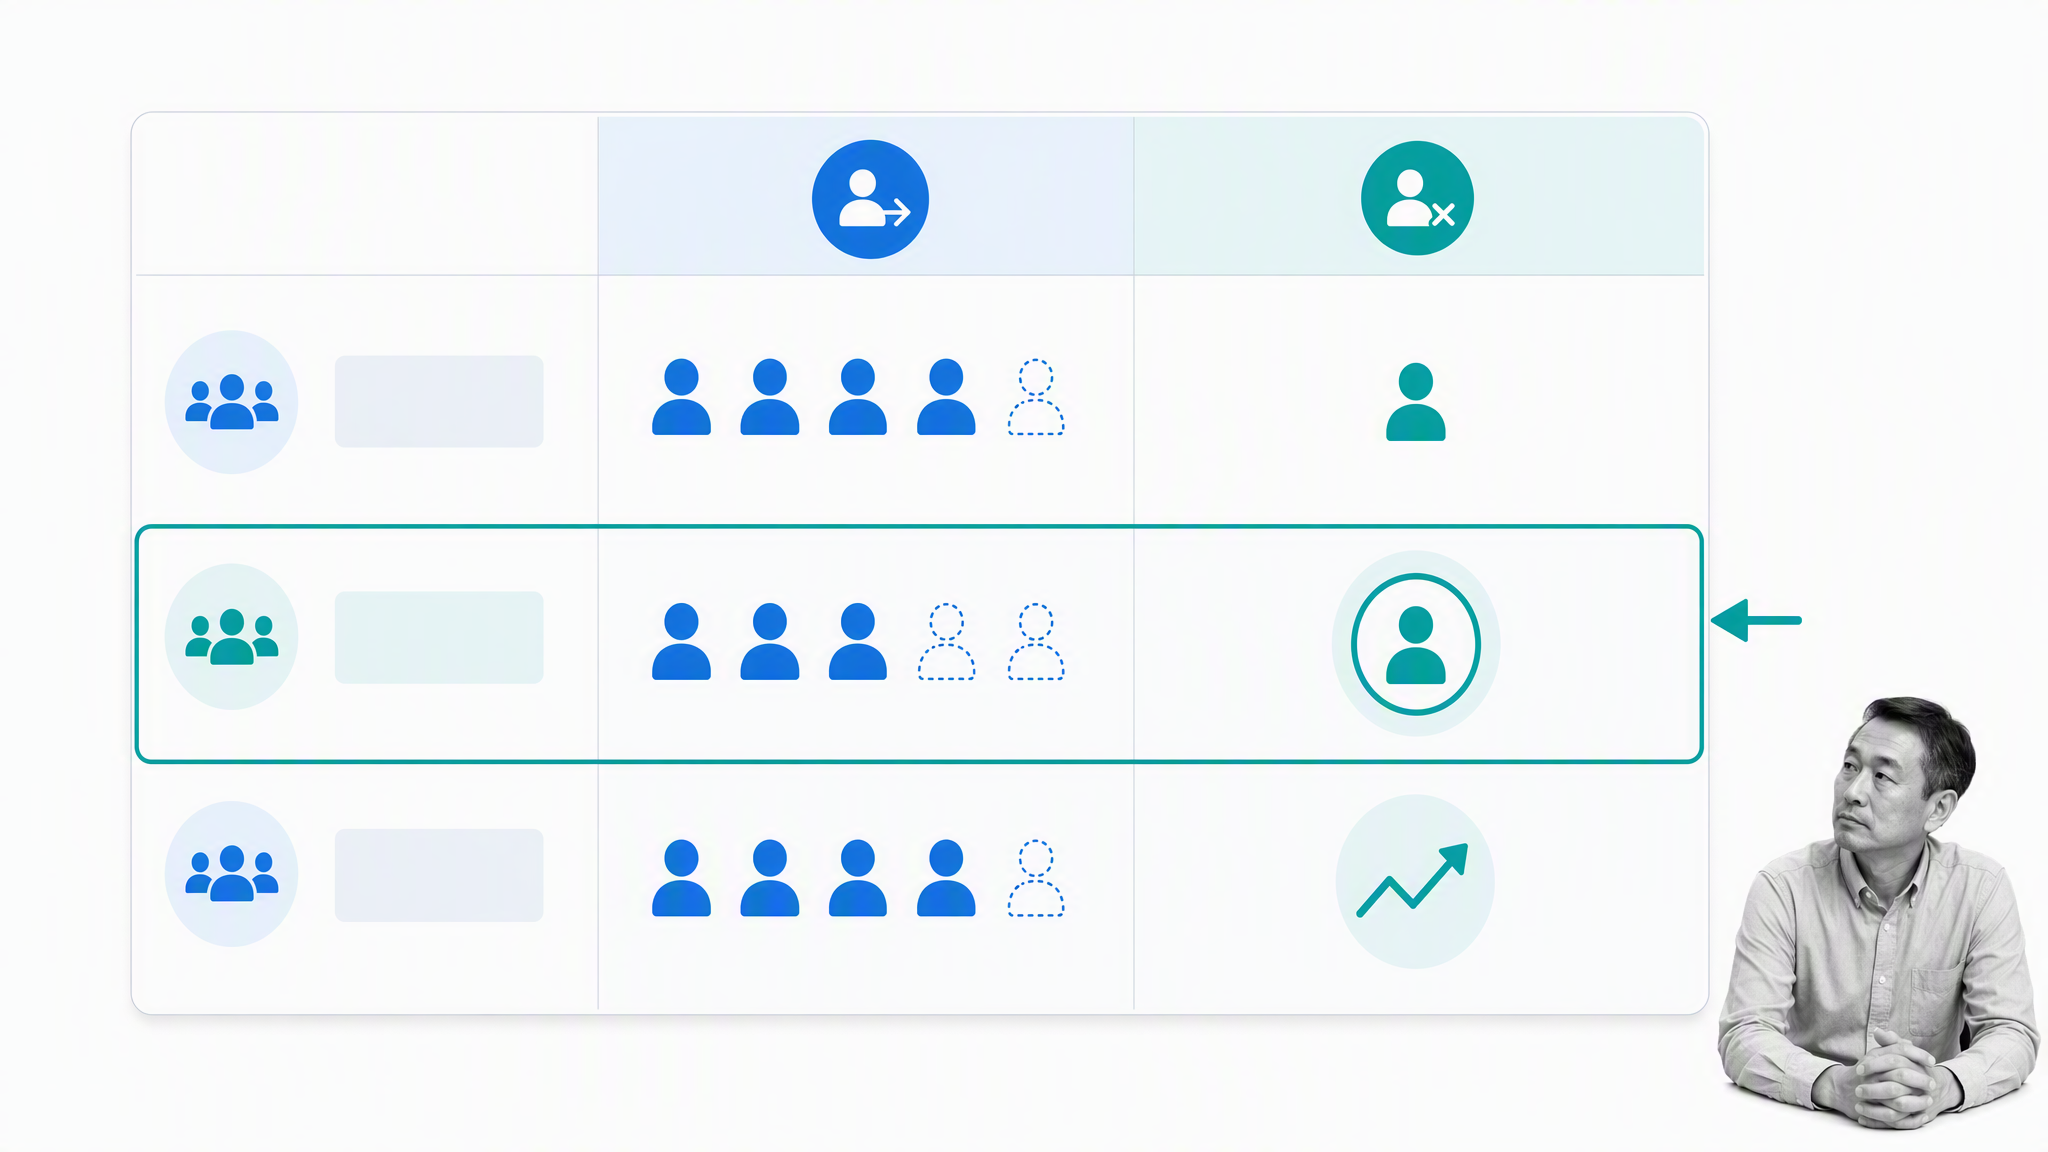
Turnover rate = employee separations during the period / average headcount during the period x 100. Average headcount can be calculated from the starting and ending headcount, or from more frequent snapshots when the workforce changes quickly. Report the period and population beside the number.
Separate voluntary, involuntary, regrettable, and non-regrettable exits. A nonzero turnover rate is normal, and some movement can create room for better role fit. The more useful question is whether the organization is losing people it intended to retain, whether exits cluster under a manager or within a role, and whether the pattern creates operational risk.
High turnover can be indicative of larger, more deep-rooted issues within a business. A common denominator may be a company culture that has started to turn sour, employees feeling overworked and undervalued, or a business changing so much that employees who once championed it no longer see a good fit. Finding the pattern early is critical to maintaining the team needed to achieve business goals. That said, a long-term turnover rate of zero is not entirely healthy. Individual aspirations change, companies evolve, and employees can outgrow the company just as the company can outgrow a role.
Review overall turnover monthly or quarterly, then investigate material changes with exit themes, tenure bands, internal mobility, pay position, workload, and manager data. Small groups need suppression thresholds so a chart cannot reveal an individual. Do not treat one exit interview as a complete explanation. Look for recurring patterns, confirm them with other evidence, and assign an owner to the response.
What do retention-risk signals reveal?

There is no responsible formula that turns one survey answer into a reliable list of employees who will leave. Use aggregated retention-risk signals instead: changes in engagement, internal mobility, absenteeism, manager stability, workload, pay equity, and regrettable turnover at a cohort level. Apply a minimum group-size threshold before displaying results.
Pulse surveys can provide a directional signal when questions stay consistent and participation is voluntary. Compare the trend for a sufficiently large group, then ask what operational condition could explain it. A declining score may point to unclear priorities, limited development, poor workload design, weak manager follow-through, or a change in trust. It is a prompt for investigation, not a diagnosis.
The action layer matters most. Route an aggregated pattern to a trained owner, record the hypothesis, choose a proportionate intervention, and schedule a follow-up measurement. Never label a person as a flight risk, scrape private communications, or make an employment decision from a hidden model. Privacy, transparency, and human review are part of the metric design.
Performance metrics for employee development
Performance metrics should clarify whether people can succeed in their roles and see a credible path forward. They work best when role expectations are explicit, managers provide evidence, and employees have a chance to discuss context. A single score without those controls creates false precision.
How many new hires succeed after onboarding?

Onboarding success rate = new hires who meet the agreed completion outcome / eligible new hires in the cohort x 100. Define the outcome before the cohort starts. Depending on the role, it may combine access readiness, required learning, a manager check-in, role-specific work evidence, and completion of the probation or introductory period where applicable.
Do not make the employee solely responsible for onboarding success. Access, equipment, training, manager availability, peer support, and workload are organizational inputs. The SHRM guidance on measuring onboarding recommends connecting the program to outcomes and collecting feedback. Where probation periods are used, apply the organization’s policy and local requirements; Acas explains the UK context.
The percentage of probations passed and failed can be a controversial metric because talent professionals may deem onboarding to be the responsibility of both a manager and the employee, with less input from hiring teams. Setting responsibilities aside, it can still be insightful. A high number of employees failing a probation period or needing it extended is a worrying sign that requires digging and attention. It may mean expectations are being miscommunicated, targets are too ambitious, or onboarding plans are not enabling candidates to be successful.
Review onboarding at 30, 60, and 90 days or at role-appropriate milestones. Diagnose failures by checkpoint. If access repeatedly arrives late, fix provisioning. If expectations are unclear, improve the role plan. If manager contact is inconsistent, change the management routine. Cohort evidence should improve the system rather than become a shortcut for judging an individual.
Are there enough career progression opportunities?

A useful measure is internal move rate = employees who changed role or level internally / average employee population x 100. Pair it with the percentage of employees who have a current development plan, time to fill roles internally, and representation across promotions. No single promotion quota fits every organization or every year.
Career maps make progression more concrete. Define what the next level requires, the evidence that demonstrates readiness, and the experiences an employee can pursue. Include lateral moves, project leadership, specialist tracks, and temporary assignments. A narrow ladder can make strong employees feel stuck even when the organization has valuable work they could grow into.
Review progression quarterly, but discuss development in regular manager conversations. Look for bottlenecks by function, level, manager, and demographic group where sample sizes protect privacy. If movement is low, the answer may be clearer role architecture, fairer access to stretch work, stronger succession planning, or better visibility into open roles rather than simply promising more promotions.
What do performance reviews reveal?
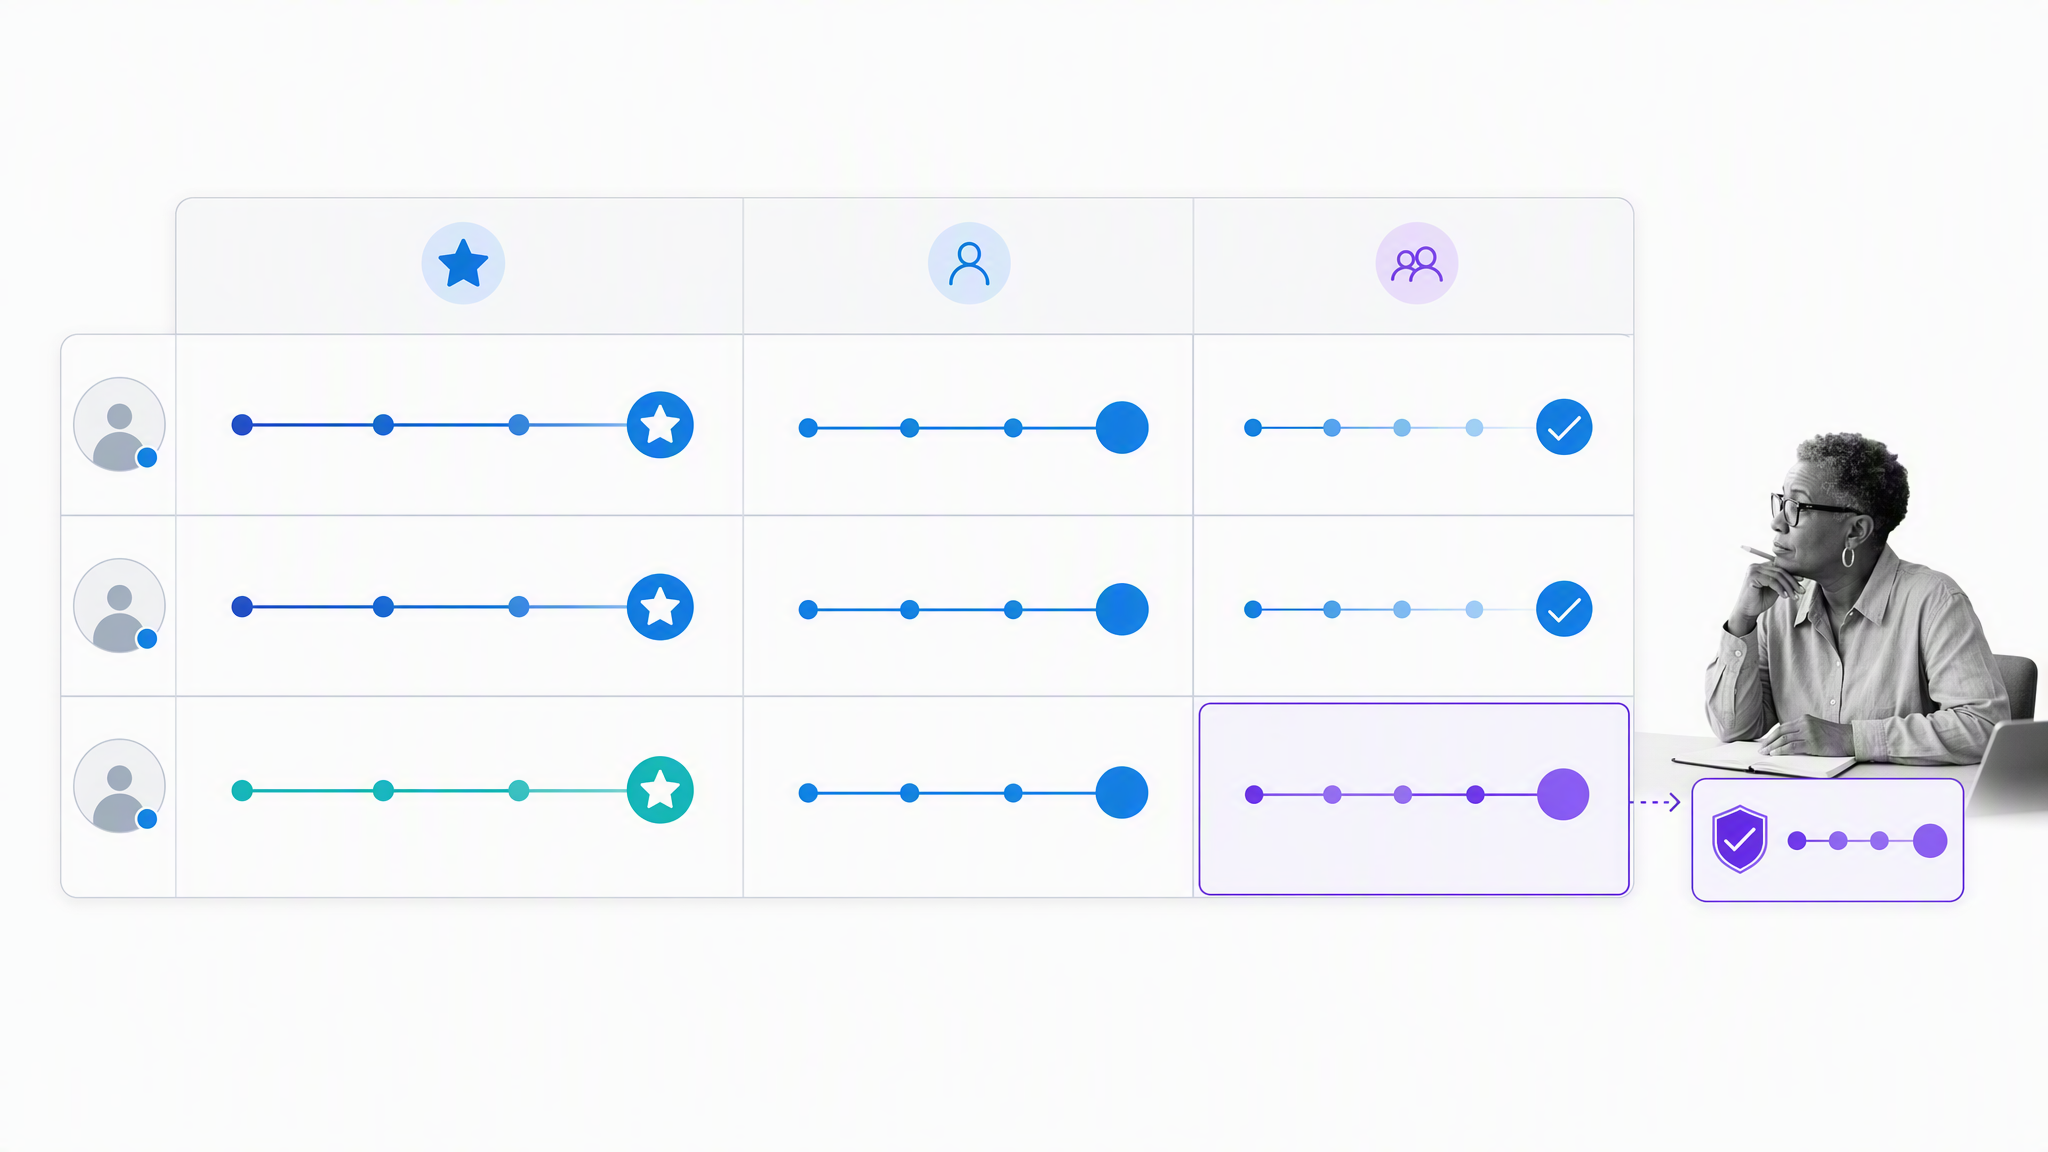
Performance review completion is operationally useful: completed reviews / eligible reviews x 100. It shows whether the agreed process happened. It does not show whether the review was fair or useful. Pair completion with goal evidence, role expectations, quality checks, employee feedback, and calibration outcomes.
Calibration helps managers compare evidence and apply the same standards across similar roles. It should not force a predetermined rating distribution. Review an outlier when the evidence, expectations, and proposed outcome do not align. Document the reasoning and give the employee a clear way to understand the decision. Team-level patterns can reveal unclear goals, inconsistent standards, or gaps in manager capability.
Use a cadence that matches the work. Many teams benefit from frequent check-ins and a more formal semiannual or annual review. A good performance appraisal process captures evidence throughout the period so the final conversation is not driven by recency. Keep protected characteristics and unrelated personal information out of the scoring process.
Employee metrics for wellbeing and satisfaction
Wellbeing and satisfaction measures can reveal whether the working environment supports sustainable performance. They are sensitive by nature. Collect only what you need, explain how the data will be used, protect small groups, and make the resulting action visible. Repeated surveys without follow-through teach employees that feedback is pointless.
What does your employee NPS show?
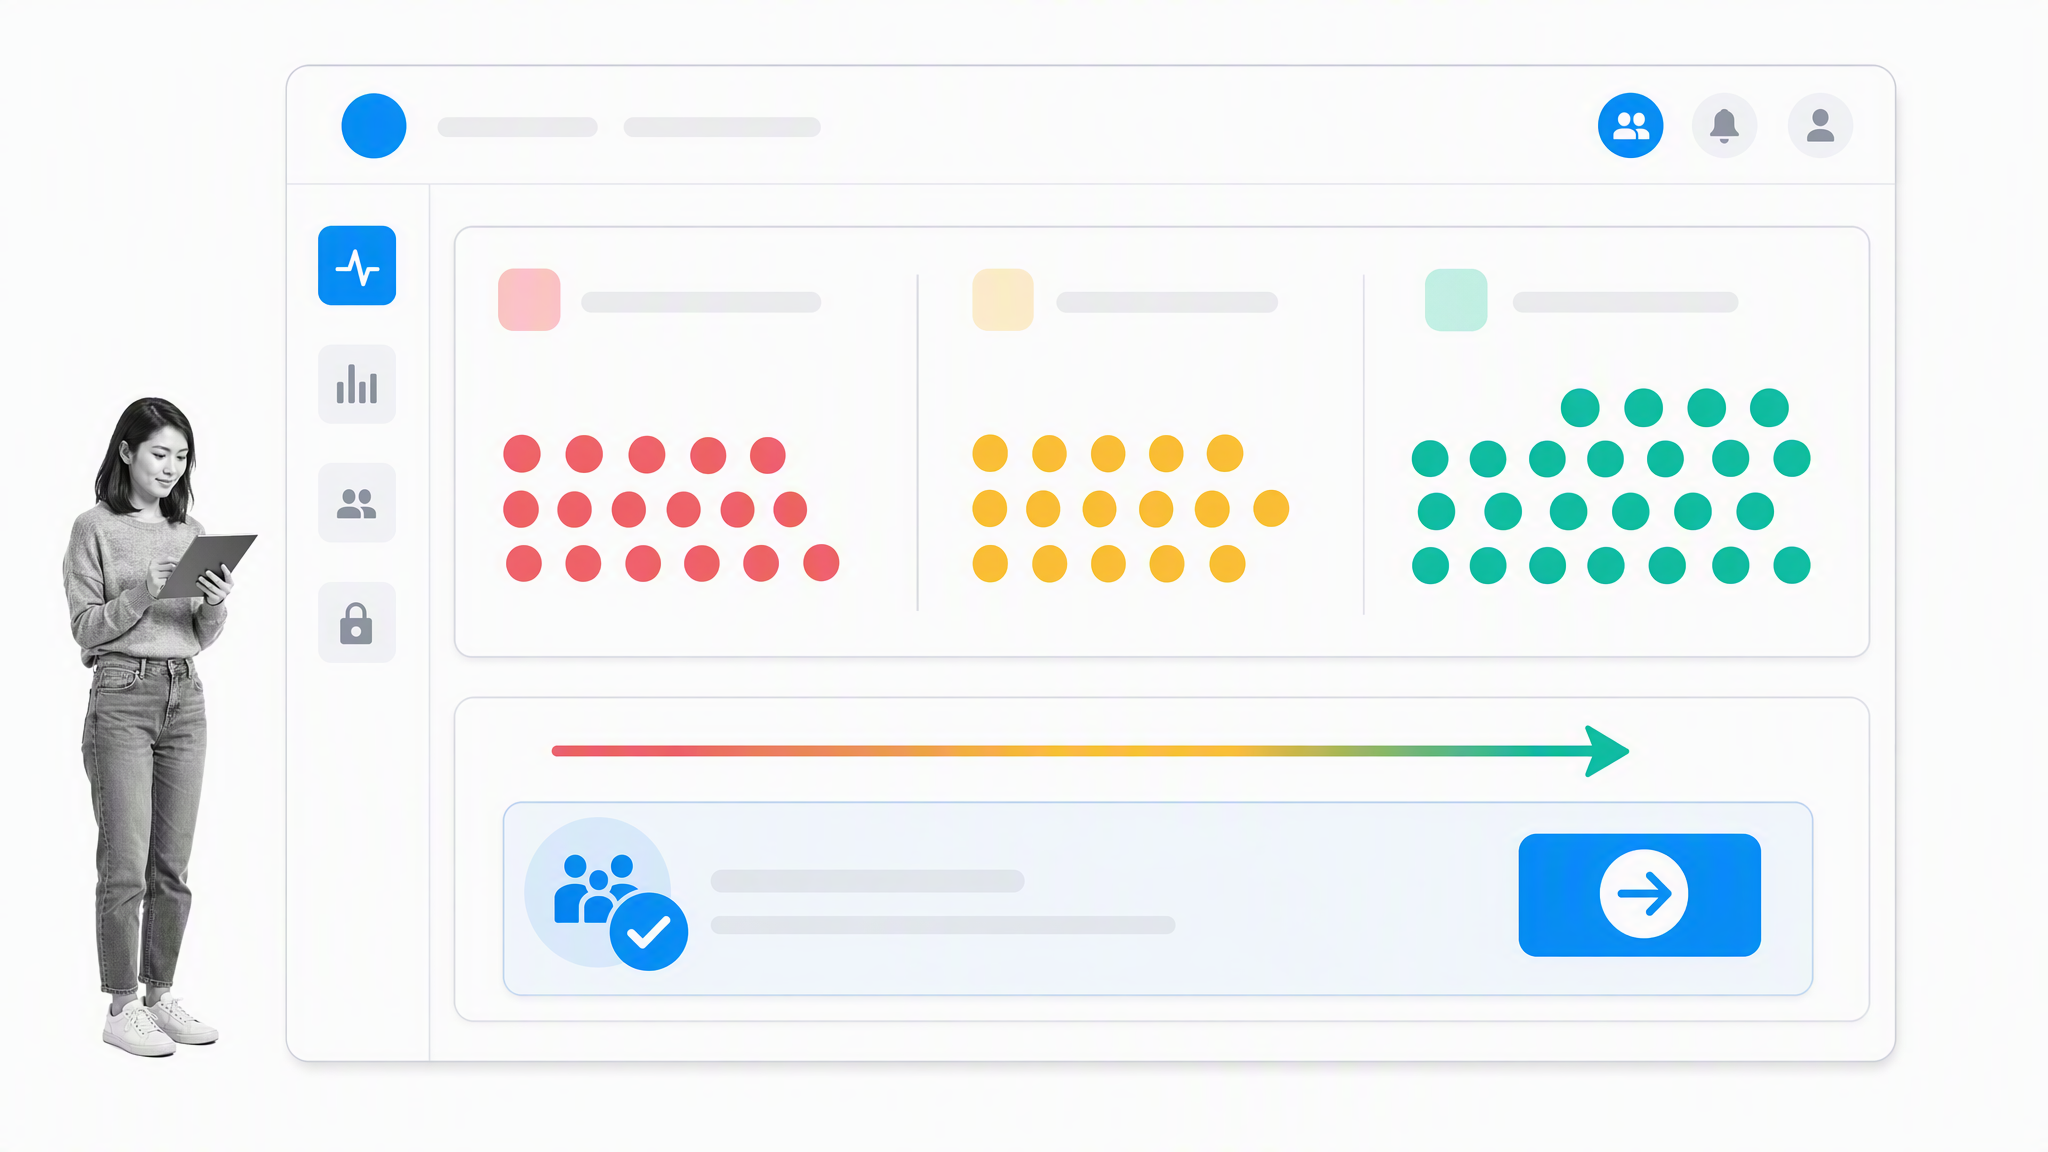
Employee Net Promoter Score asks how likely an employee is to recommend the organization as a place to work. eNPS = percentage of promoters minus percentage of detractors. Promoters select 9 or 10, passives select 7 or 8, and detractors select 0 through 6 on the standard 0-to-10 question.
Treat eNPS as a directional measure. As Qualtrics notes in its eNPS guidance, the score is simple but needs context. A quarterly or semiannual trend can flag a change in employee experience, but the number alone does not explain the cause. Use an optional open question and follow-up listening methods to understand what shifted.
Do not identify an individual detractor or assume a low score means that person plans to leave. Check response rate, population changes, survey timing, and cohort size. Share the aggregate result, name one or two actions, and report back on progress. The credibility of the process depends less on the score than on what leaders do after receiving it.
How psychologically safe is your workplace?
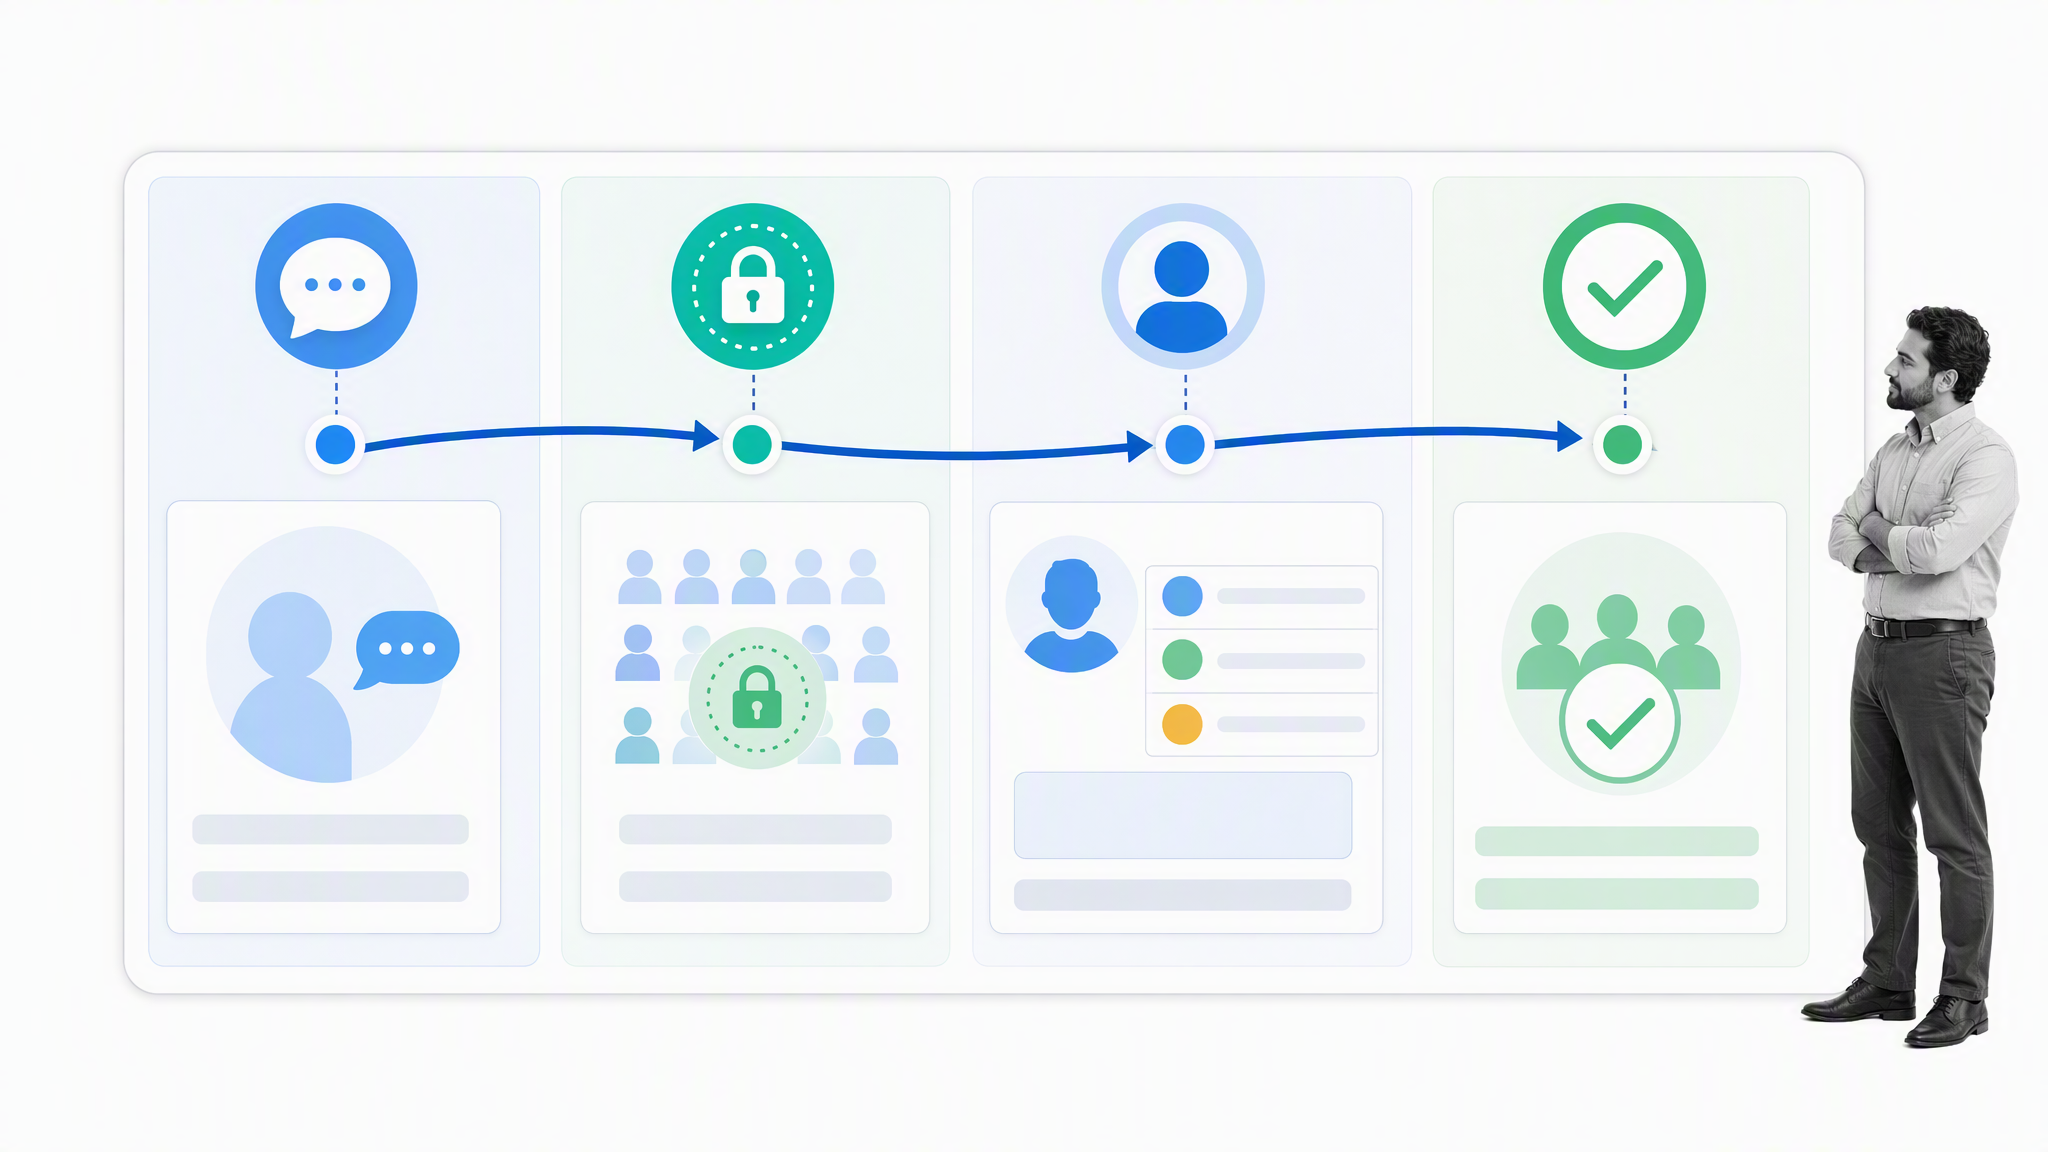
Psychological safety is the shared belief that people can speak up with questions, concerns, mistakes, and ideas without fear of humiliation or punishment. The Process Street guide to psychological safety connects it to team climate and leadership behavior. It is not the same as comfort, agreement, or freedom from accountability.
Measure it with a short set of consistent, behavior-based statements such as whether it feels safe to raise a problem or ask for help. Report a favorable-response percentage or mean score only for groups large enough to protect respondents. Pair the survey with speak-up channels, incident patterns, retrospective quality, and evidence that leaders close the loop.
If a team’s trend falls, the action should focus on conditions: how leaders respond to bad news, whether meetings invite dissent, whether mistakes are examined fairly, and whether concerns receive a visible response. Do not use a team score to identify a supposed problem employee. Psychological safety grows when leaders reward candor and follow through on issues people take the risk to raise.
Are employees using their PTO?
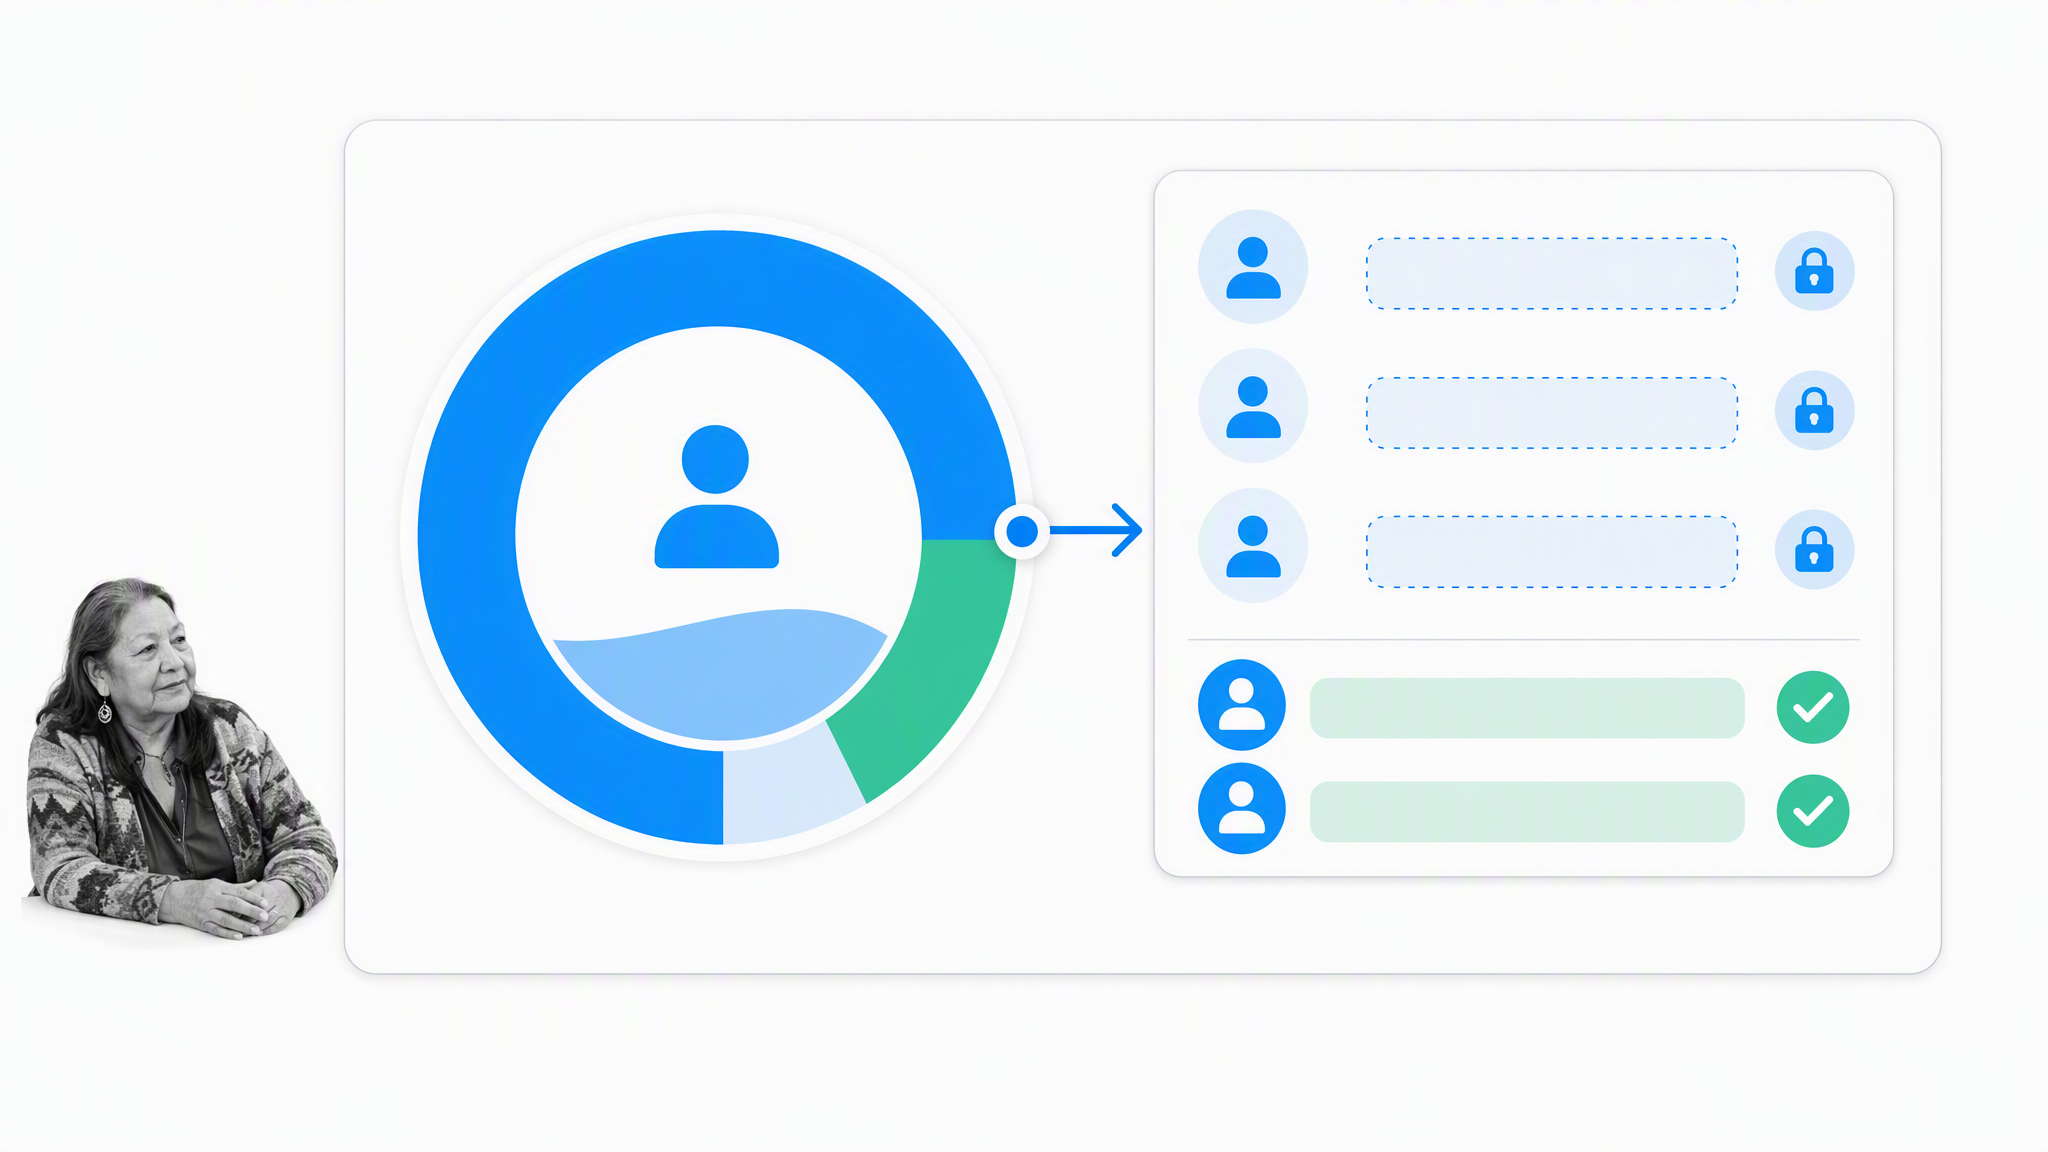
PTO utilization rate = paid time off used / paid time off available x 100. Define how carryover, accrual, parental leave, sick leave, and unlimited leave policies affect the denominator. Review the trend monthly or quarterly and compare like-for-like groups. There is no universal number of days that suits every country, contract, tenure band, or leave policy.
Low utilization can signal heavy workload, poor coverage, manager behavior, unclear policy, or fear that time away will harm progression. High utilization may simply reflect seasonality or employees using an earned benefit. Look at forfeited balances, canceled leave, coverage readiness, and differences between managers before drawing a conclusion.
The amount of PTO employees are taking can reveal a lot. In many instances, reluctance to take a holiday comes from unmanageable workloads holding people back or anxiety about disappointing an employer. Taking time off is essential for employee wellbeing; everyone needs to rest and recharge away from work. Managers can actively encourage their team members to take the time off they are due and put measures in place so other team members can manage work effectively while an employee is away. Reassurance matters, but coverage reduces the anxiety felt when taking time off.
Make leave usable by planning handoffs, documenting recurring work, cross-training owners, and modeling time off at senior levels. A reminder near the end of a leave year may help, but it cannot fix a team that has no coverage. The operational question is whether employees can disconnect without essential work failing.
How do you decide what to prioritize?
Choose metrics from the decisions your organization needs to make in the next planning cycle. A hiring constraint may make headcount growth and onboarding success urgent. A cluster of regrettable exits may put turnover and progression first. A reorganization may require stronger psychological-safety and workload signals. Measure fewer things well, with an owner and an action threshold, before expanding the dashboard.
- Define: document the population, period, formula, owner, data source, privacy threshold, and intended decision.
- Validate: check completeness, changes in definitions, missing groups, and whether the measure can be interpreted fairly.
- Review: compare the trend and relevant cohorts, record context, and avoid universal benchmarks that do not fit the operating model.
- Act: assign a response, due date, and evidence of completion when a threshold or pattern requires attention.
- Learn: revisit whether the metric led to a better decision and retire measures that create reporting work without value.
Process Street is one Compliance Operations Platform with Docs and Ops capability areas plus built-in AI. Docs can govern metric definitions, access rules, and review standards. Ops can run recurring collection, approval, investigation, and follow-up workflows. Built-in AI can help summarize approved evidence and route work inside those controls, but it should not label an employee or make an employment decision from a single score.
The result should be a small, trustworthy measurement system: common definitions, protected data, clear ownership, and visible action. That is how employee metrics become an operating tool rather than another dashboard people stop reading.
Employee metrics FAQ
What are the most important employee metrics?
The most important metrics are the ones tied to a current workforce decision. A balanced starting set covers capacity and retention, employee development and performance, and sustainable work. Use a small number of clearly defined measures with owners, privacy safeguards, and action thresholds.
How often should HR metrics be reviewed?
Operational measures such as onboarding checkpoints may be reviewed weekly or monthly. Strategic measures such as turnover, internal mobility, eNPS, and psychological safety are often more useful monthly, quarterly, or semiannually. Choose a cadence that allows action without creating noisy reporting.
What is the difference between HR metrics and people analytics?
HR metrics are defined measures such as turnover rate or onboarding success. People analytics uses those measures, additional evidence, and structured analysis to answer a business question. Metrics are inputs; analytics is the reasoning that connects evidence to a decision.
How do you protect employee privacy in workforce reporting?
Collect only necessary data, disclose its use, restrict access, suppress results for small groups, aggregate sensitive signals, document retention periods, and require human review. Never infer an individual’s intent or condition from a single survey response or hidden model.